| |
#create conmean function#
conmean <-function(data,min,width,step,nsteps) {
left <- min
x <- matrix(nrow=nsteps,ncol=5)
for (i in 1:nsteps) {
bin <- subset(data,Age>=left & Age < left+width)
x[i,1] <- mean(bin$Age)
x[i,2] <- mean(bin$mthpay)
x[i,3] <- median(bin$mthpay)
x[i,4] <- var(bin$mthpay)^0.5
x[i,5] <- length(bin$Age)
left=left+step
}
return(x)
}
# the wage-age function is not linear over the full Age range, hence #
# create a subset of trimmed wages with Age < 51 #
# use your own subset names as appropriate #
wage2 subset(wage1, Age < 51)
# run the conmean function and plot mean and median wage-age profiles #
m08 <- conmean(wage2,15,6,1,36)
plot(m08[,1],m08[,2],type="l",lwd=2,ylim=c(4000,19000),xlab="Age",ylab="Pay")
lines(m08[,1],xm08[,3],lwd=2,col=2)
# next estimate a linear model using least squares - the lm( ) function #
# results are stored on the object modls #
modls <- lm(mthpay ~ Age , data=wage2)
summary(modls)
modls$coefficients
aa <- modls$coefficients[1]
bb <- modls$coefficients[2]
abline(aa,bb,lwd=2,col=3)
# next follow the instructions to install the package "quantreg" that calculates quantile regressions #
# run quantreg and store results in modqr #
abline(aa,bb,lwd=2,col=3)
chooseCRANmirror()
install.packages("quantreg")
library(quantreg)
modqr <- rq(mthpay ~ Age,data=wage2)
summary(modqr)
aaa<-modqr$coefficients[1]
bbb<-modqr$coefficients[2]
abline(aaa,bbb,lwd=2,col=4)
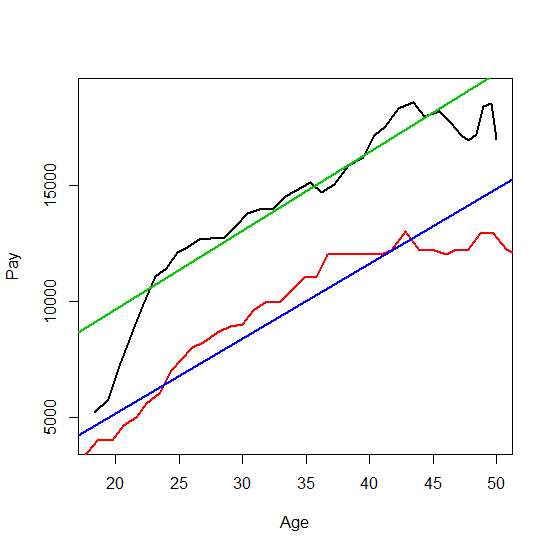
# The resulting chart is shown below#
# Note how the least squares mean regression (green) "fits" the nonparametric mean regression (black)#
# The linear median regression minimizes absolute values of prediction errors #
# The linear median regression (blue) "fits" the nonparametric median regression (red) #
|